
VPC Flow Logs
VPC Flow Logs
Project Overview
In this project, I set up a system to watch for suspicious network activity in Google Cloud. Just like security cameras monitor who enters and exits a building, I used something called VPC Flow Logs to monitor traffic going in and out of virtual machines (VMs). This helped me see where connections were coming from, what ports they were targeting, and if anything seemed off. I exported this data for deeper analysis and real-time alerts.
Why This Matters
🕵🏽♂️ Imagine this:
You're in your house. Everything feels normal. But…
You hear a faint creak upstairs.
You check your cameras… nothing.
You walk by the closet… and someone’s hiding in there.

Now imagine that house is your cloud infrastructure.
💻 In the Cloud:
You’ve got a virtual machine (VM) running in Google Cloud — quietly doing its job. But without VPC Flow Logs, you have no idea who’s knocking at the digital door trying to gain access.
Someone could be probing port 3389 (Remote Desktop)
A botnet might be scanning for SSH vulnerabilities
Untrusted traffic could be hitting your system from unknown regions
And without logging, you’d never know.
That attacker could sit quietly in your cloud “closet” for days — or worse, get in.
Skills Demonstrated:
GCP VPC flow logging & visibility
Log filtering and analysis (Cloud Logging)
Threat detection through port-specific filters (e.g., RDP on port 3389)
BigQuery log analysis and custom queries
Pub/Sub integration for SIEM streaming
Export sink creation and log routing
Cloud Shell & gcloud CLI usage
Step 1: Enable VPC Flow Logging
To start monitoring network traffic, I first turned on VPC Flow Logs using gcloud in Cloud Shell. It is like turning the surveillance system on. I used the following codes to enable the network monitoring:
What this command does:
This enables VPC Flow Logs on the subnet in the europe-west1 region and includes all connection metadata.
gcloud compute networks subnets update default \
  --region=europe-west1 \
  --enable-flow-logs \
  --logging-metadata=include-all
What this command does:
This enables VPC Flow Logs on the subnet in the europe-west1 region and includes all connection metadata.
gcloud compute networks subnets update default \
--region us-east4 --enable-flow-logs \
--logging-metadata=include-all
Step 2: Create Virtual Machines (VMs) and Simulate Traffic
In this step, I spun up 3 virtual machines (US, EU, and Asia) and simulated normal internet behavior between them. In the Command Line Interface, create three regional Virtual Machines (VMs). You can see the code in the “Create VM” section. Once the VMs are up and running, each will have their own output like in the “Instance Details” section.
💻 Create VM: default-us-vm
gcloud compute instances create default-us-vm \
  --machine-type=e2-micro \
  --zone=us-east4-c \
  --network=default
🧾 Instance Details: default-us-vm
NAME: default-us-vm
ZONE: us-east4-c
MACHINE_TYPE: e2-micro
PREEMPTIBLE:
INTERNAL_IP: 10.138.0.2
EXTERNAL_IP: 34.85.149.158
STATUS: RUNNING
💻 Create VM: default-eu-vm
gcloud compute instances create default-eu-vm \
  --machine-type=e2-micro \
  --zone=europe-west1-d \
  --network=default
🧾 Instance Details: default-eu-vm
NAME: default-eu-vm
ZONE: europe-west1-d
MACHINE_TYPE: e2-micro
PREEMPTIBLE:
INTERNAL_IP: 10.132.0.2
EXTERNAL_IP: 34.14.24.130
STATUS: RUNNING
💻 Create VM: default-ap-vm
gcloud compute instances create default-ap-vm \
  --machine-type=e2-micro \
  --zone=asia-east1-b \
  --network=default
🧾 Instance Details: default-ap-vm
NAME: default-ap-vm
ZONE: asia-east1-b
MACHINE_TYPE: e2-micro
PREEMPTIBLE:
INTERNAL_IP: 10.140.0.2
EXTERNAL_IP: 34.81.92.57
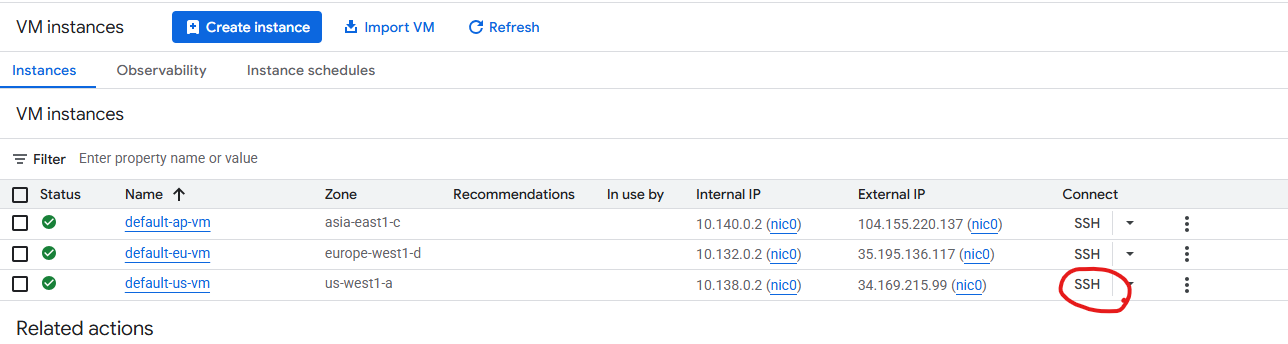
STATUS: RUNNINGThe following screenshot is the result of the code previously input. It details the name, zone, internal & external IP addresses.

At this point it is paramount to record both the internal and external IP addresses of each created instance (default-ap-vm, default-eu-vm, default-us-vm).
In the row for the default-us-vm instance, click SSH to proceed. (you will repeat the following actions for the other 2 instances)
Run the following commands when connected via SSH:
sudo apt-get install -y host host www.wikipedia.org 8.8.8.8 ping -c 5 default-eu-vm.europe-west1-d ping -c 5 www.google.com curl http://www.google.com
This combination of commands accomplished a few different things:
It installed the host DNS resolution utility to verify the real IP address
Performed a DNS lookup of www.wikipedia.org using the 8.8.8.8 DNS server
Pinged the default-eu-vm instance and www.google.com
Used “curl” to create an HTTP connection to www.google.com
Step 3: View Logs in Logs Explorer
Next, I accessed and filtered logs to view connections, ports, and instance metadata using Logs Explorer in Google Cloud Console. It is like reviewing the security footage and you are able to see what happened.

Step 4: Export Logs to Big Query
I filtered the logs to look specifically for traffic aimed at port 3389 — which is the default port used by Remote Desktop Protocol (RDP). RDP is a tool that lets people remotely log in and control another computer, usually with a graphical interface. It's commonly used to manage Windows servers.
Because I wasn’t using RDP on any of my virtual machines, any attempts to connect to port 3389 are considered suspicious — like someone trying a locked door that was never meant to be opened.
Step 5: Export Logs to BigQuery and Pub/Sub
I set up log exports to BigQuery (for analysis) and Pub/Sub (for real-time alerts or streaming). This is like sending your surveillance data to a command center and alerting the team.
Step 6: Analyze in BigQuery
With logs in BigQuery, I ran a query to look for SSH traffic (port 22). This helped me confirm what traffic was normal (internal pings, expected outbound requests).
Step 7: Disable Flow Logs (Clean Up)
When finished, I turned off flow logging to reduce cost. This is like turning off the camera system when you're no longer monitoring that area.
Conclusion & Takeaways
By enabling VPC Flow Logs and exporting them to BigQuery and Pub/Sub, I built a scalable, cost-effective system for monitoring and analyzing network activity in Google Cloud — giving me insight into both legitimate and suspicious connections in real-time.
Lessons Learned
Always log cloud network activity — what you don’t see can hurt you
Filtering logs by port or protocol is a powerful way to detect threats
Exporting to BigQuery gives you tools for analysis and auditing
Default firewall rules may leave doors open — review them regularly